
Facebook’s IPO filing, released this week, is fascinating for many reasons: We’ve already covered several angles.
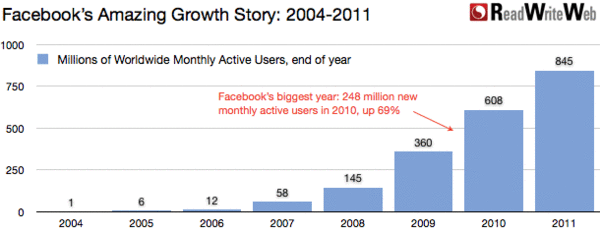
Perhaps the most exciting, though, is the wealth of data about the company that is finally public – from its user statistics to its growth around the world to its finances. I’ve highlighted and visualized some of the most interesting data in this series of charts.
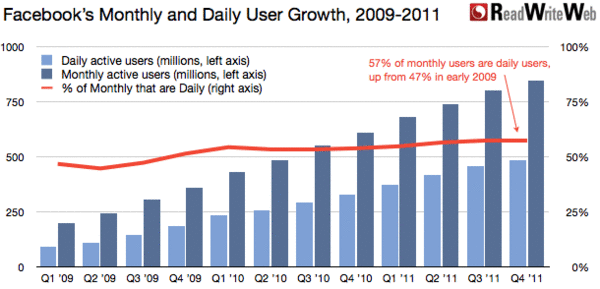
One of the most powerful things about Facebook is how many of its users log on every day.
Facebook’s IPO filing includes quarterly stats of its Monthly Active Users and Daily Active Users, both worldwide and broken down by region. (Also, how about some appreciation for Facebook to sticking with “active” users in its stats, not just total, all-time sign-ups?)

Worldwide, you can see that 57% of the people who use Facebook within a given month also use Facebook on an average day, up from 47% in early 2009.
This varies, of course, by region, which gives an idea of how “sticky” Facebook is in different parts of the world. In the U.S. and Canada, it’s 70%. In Asia, where Facebook isn’t as established – but is growing fast – it’s only about 50%.
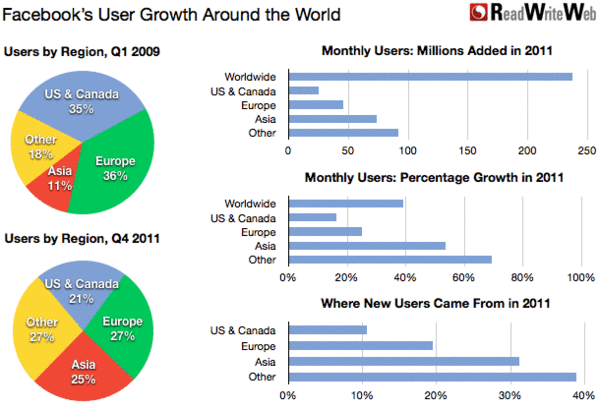
Facebook is increasingly a global story. Its user base is now almost equally concentrated in the four regions it breaks out. That’s a pretty big change from 2009, when it was primarily focused in the U.S. and Canada.

In 2011, about 30% of Facebook’s new users came from Asia, and about 40% in the “rest of world” category. Only about 10% of its new users came from the U.S. and Canada.
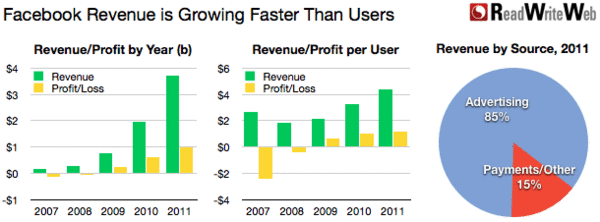
Facebook’s IPO filing also brings us new access to its finances. Here, we can see one reason why Facebook’s revenue growth (88% in 2011) is outpacing its user growth (39% in 2011) – because Facebook is bringing in more revenue per user than it did in the past.

How did that happen? Significant growth in both Facebook’s ad business (85% of its revenue) and its payments business (part of the 15% of “other” revenue).
Facebook’s future success, of course, relies on both its ability to attract new users and its ability to generate more revenue per user.


