By Alex Iskold
Marketing guru and blogger Seth Godin is also
known for his Web 2.0 Traffic Watch List on
Alexaholic. This list tracks the changes in Alexa traffic for about 1000 Web 2.0
companies. For example, MySpace and YouTube are numbers 1 and 2 respectively (although
check our
previous post, which has YouTube in the top spot). While there has been a lot of
skepticism about the precision of Alexa ranking, particularly because the ratings can be
bought or
gamed, for a large pool of popular web sites it can adequately be used as a
relative measure of popularity.
Here is the latest Seth Godin Alexaholic top 10 list:
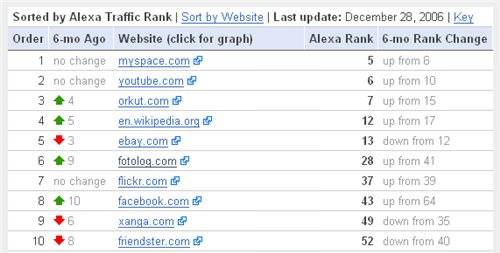
The list has generated attention in the blogging community. Paul Kedrosky wrote a post
recently entitled Hot and Not So
Hot Web 2.0 Companies, in which he identified the biggest web 2.0 gainers and losers
over the last 6 months. We found this interesting and wondered what else can we deduce
from Seth’s chart. Instead of individual companies, we wanted to determine what
trends are gaining or losing. For example, is online video continuing to rise?
Does social bookmarking have a chance to go mainstream? We looked into Seth’s data to
answer these questions.
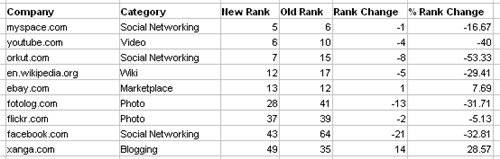
How we looked at the data
Seth Godin’s list shows only companies, but not trends. As the first step, we labeled
each company with a category such as Video or Social Networking. Next, we calculated
additional information needed to determine growth. For each company, we calculated the
% Change in Rank. This is the number which indicates relative change in
the ranking of each company. The reason for using this percentage change instead of the
actual change number is to take into consideration that fluctuations at the top of the
list are much smaller than fluctuations at the bottom. Here are the first 10 entries from
the new list:
Trends for top 100 companies
We then labeled the top 100 companies with the categories and calculated the common
values for each category. Here is what came out:
Green = Growth; Red = Decrease
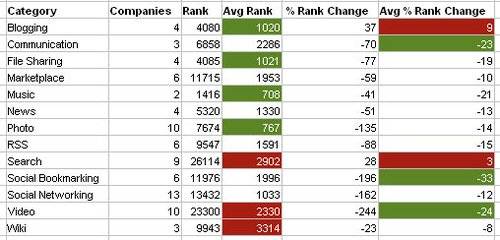
Important Note: lower figures mean more popularity
There is a lot of interesting information. First note that Photo is the most
populated category in the top 100, with 10 companies falling under this category. It is
closely followed by other usual suspects: Search, Video and Social
Networking.
Looking at the Average Rank column gives us the current average
standings. Since lower Alexa ranking implies more popularity, Photo and
Music hold the lead, followed by Blogging and File Sharing
(note that File Sharing includes storage, like Box.net). Among the worst rankings we find
Search and Video. Search is probably is not surprising,
because Google has a strong grip on this category. The reason that the Video
average is not great is because the players in the top 100 are at the bottom, with the
exception of course of YouTube and DailyMotion.
Perhaps the most interesting information is the Average % Rank Change, because
this information indicates growth. Remember that the lower the figure, the more
growth it indicates. We were somewhat surprised to find that the six players in the
Social Bookmarking space saw the most substantial growth in the last six months.
This indicates that social bookmarking is heading towards the mainstream. It is not
surprising to see big growth in video, but interesting to see Meebo contributing strongly
alongside Skype to the Communications category.
The data also reveals more bad news for the Search category, as it
experienced an overall drop in the last six months of 3% points. Again, fighting Google
is no easy thing. Finally, the Blogging category had the biggest drop of 9%
points. Perhaps this can be attributed to people blogging on their social networking
sites, but this is not obvious – although Xanga, Livejournal and SixApart all decreased
in popularity. It could also be that more people are using WordPress, which is on the
rise (but not on the list).
Conclusion
It would be interesting to expand on this research and look at the trends for the
entire 1000 companies. It would also be interesting to see what companies are influencing
the trends the most. Surely the MySpaces and YouTubes of the world, but what other
companies? The information on Seth’s list can be analyzed in a number of different ways,
to gain insights into what is happening in our fast changing Web 2.0 world.
You are welcome to use the spreadsheet we created to do more
analysis. Of course the only catch is that you have to share the results with us 🙂
Update: There was a slight error in the original spreadsheet, so we have amended that. Thanks Dermot for pointing it out.