
In this post we analyze how web 2.0 companies are bringing price trending tools, traditionally found on Wall St, to the masses. We take a look at these latest consumer internet innovations, and try to understand if they are useful and if they can succeed. The companies reviewed in this post are Farecast, Mpire and Trulia.
When it comes to buying things, people differ a lot. Some buy on impulse, others spend weeks researching. People who buy quickly enjoy the adrenaline rush of the purchase and a lot of free time. The methodical hunters are willing to exchange hours of patience for the satisfaction of buying just the right product. What hunters are looking for is to buy what they want at the price they like to pay.
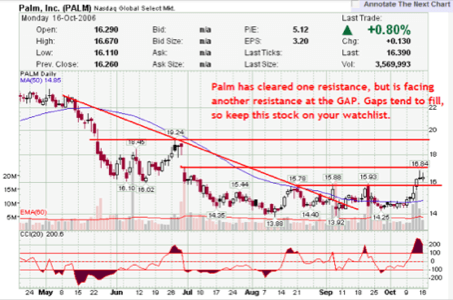
Arguably, no one spends more time perfecting the art of bargain hunting than people on Wall Street. They rely on their experience, algorithms and a ton of information to make daily buy/sell decisions. Among their rich toolbox, a special place is taken by a very basic tool – a chart. Wall Charts, however, are not your high school algebra charts. They contain an overwhelming amount of information, including historical pricing and trends. Why are these charts so useful? Because knowing what is happening now and what has happened in the past, helps rationalize what might happen in the future. The chart is a forecasting tool.
Quick Trends Primer
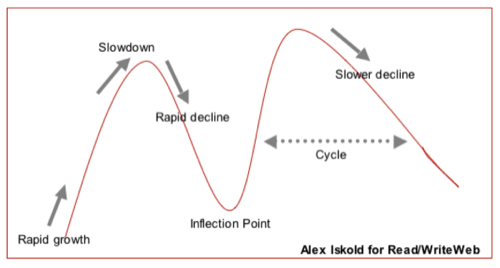
What is the difference between an amateur and a pro looking at the same chart? The amateur just sees the curve, the pro looks at the rate of change. Just because price is dropping today does not mean that it will continue to drop tomorrow. The best time to buy is at or near the inflection point, but to forecast the inflection point one has to consider the slope of the growth curve. Historical information sheds light into the rates of growth, as well as length of the pricing cycles; and it helps estimate where the prices are headed tomorrow.
Traditionally, understanding these trend charts has been considered a rocket science. This is why the smart folks on Wall Street get paid the big bucks. But just recently we have seen a rise in the number of web companies that are trying to bring the idea of price trends to the masses. These companies deliver the information in a simplified format and issue trend-based recommendations. Let’s take a look at some examples…
Farecast – helping people save money on travel
Hugh Crean, CEO of Farecast had an idea to apply price trending to airfares. He fought hard to gain access to this difficult-to-get information and eventually prevailed. The result is essentially a travel oracle that saves you money on airfares. Farecast is for people who plan their trips just slightly in advance. After you fill in your dates and destinations, the service shows you price trends for the last 90 days and then issues a recommendation on when to buy the ticket.
This is impressive. Since interpreting the charts may still be difficult for people, a simple bottom-line recommendation is very appropriate. Together with the chart, it gives the user confidence in their decision – along with a bit of an understanding about why the decision was made. Along with the recommendation, users can follow links to airline websites and major travel search engines, like Expedia or Orbitz, to buy the tickets at that discount. Farecast is really well executed and should see good growth, once it incorporates more cities (it has 75 today) and more airlines.
Mpire – helping people save money on products
Mpire was recently in the spotlight because it launched trend widgets for blogs and social network profiles. The core service of this comparison shopping engine is price trends for basic products, ranging from books to electronics. For each phrase that you type into Mpire you get back a price chart, similar to the one shown below for iPod and 1GB iPod Shuffle:
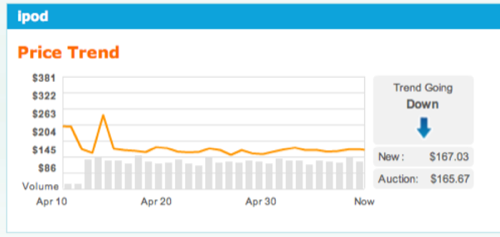
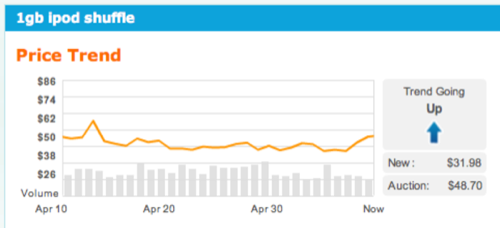
The service information is based on prices on eBay, Amazon, BestBuy, Walmart and thousands of online retailers. On the surface this is similar to Farecast, but there a few subtle differences. The first one is that Mpire does not just operate on product names, but phrases too. You can enter Apple 80 GB iPod video Black, but you can also enter Da Vinci Code. The problem with the latter is that it’s unclear if it is a book or a movie.
Trending specific products would be an essential enhancement for Mpire. Also, it would be helpful to have a bottom line recommendation like Farecast, so that users do not need to do the heavy lifting – or heavy squinting.
Trulia – helping people save money on real estate
In the real estate space, Trulia has been innovating by applying mashups, heatmaps and trending charts to US cities. The service is very impressive, as it manages to compact an amazing amount of information into a simple and easy to use interface. The core user interface consists of a search with the results shown over a map. In addition, users can also see a chart of historical prices, like the one for New York City shown below.
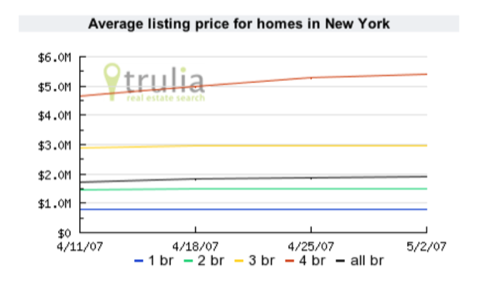
If you take a close look at the chart above, you will notice that New York City is quite expensive! You can also tell that a lot of very rich people with kids are making a run for 4 bedroom apartments. But back to Trulia now. It would be great to see a wider range of historical information, but I do not see a way to get it from the current interface. However, Trulia does issue a bottom-line recommendation – it calls New York a “hot city”, implying not only that the prices are high – but that people are buying.
Conclusion
Charts offer a great way of understanding information. In our (short) Attention (span) Economy, charts offer a shortcut to understanding large volumes of data. Mastering the art of understanding charts can save you both money and time. So it seems that the services that we covered in this post are really onto something. By offering people insights into historical prices and trends, they empower people to make more informative decisions about their purchases. Lets hope to see more of these in the near future. Now tell us please about your favorite trending services.