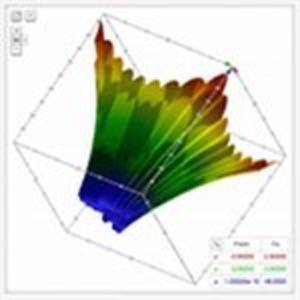
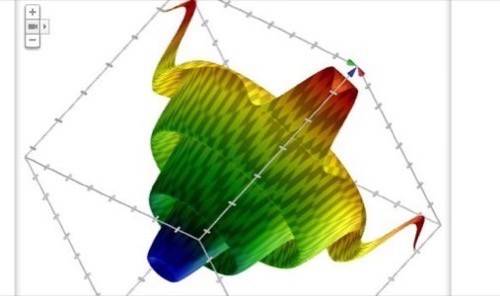
Google has decided to make its simple search box into yet another thing. It’s now a WebGL-powered 3D graphing calculator. If you type in a two-variable function, Google’s search box on the desktop will graph an animated, interactive, 3D plot right in your browser.
Google is moving increasingly toward providing answers when they’re faster than Web results. But putting an advanced graphing calculator into search is an obvious defense against Wolfram Alpha, which is notably Apple’s Siri partner for math and science questions. Google search is fighting a two-front war, with Facebook and social search on the other side. How many things can Google search be at once?
Google has had Universal Search for five years, but the landscape has shifted drastically. When Google added images, videos, maps and places to search results, it only secured its dominance over those verticals. Google’s competitors freaked out, but Google pressed ahead.
This ill will is coming back to bite Google now. Yelp, the highest-profile company that objected to Google’s Universal Search practices, is now going public and hitching its wagon to Apple. When iPhone 4S users use Siri to search for a restaurant or gas station, it will bypass Google altogether and use Yelp.
Likewise, Siri uses Wolfram Alpha for math and science questions. It’s a “computational knowledge engine” built on the theories and proprietary programming language of Stephen Wolfram. Graphing isn’t just built into it; it’s a primitive concept of the language underlying it. Can Google compete with that?
Well, not until WebGL works on phones. But at least on the desktop, Google is still devoted to the idea of using search as a starting point for everything on the Web. It’s contending with Wolfram Alpha on the side of computed answers, and it has Facebook’s dominant social graph on the other side in personalized search. Facebook is reportedly building new search technology, too.
Time will tell whether the convenience of having all these disparate services in one place will win out, or whether Google’s notion of search will be stretched too thin.
The new graphing capabilities work internationally on modern desktop browsers like Chrome and Firefox, as well as Safari, which Google’s blog post unsurprisingly neglected to mention – if, that is, you don’t have a “low-end” system like the most recent MacBook Air.
You can try it out by pasting this function into Google on your desktop:
sqrt(cos(3*x))*cos(100*y)+1.5*sqrt(abs(x)) + 0.8 x is from -1 to 1, y is from -1 to 1, z is from 0.01 to 2.5