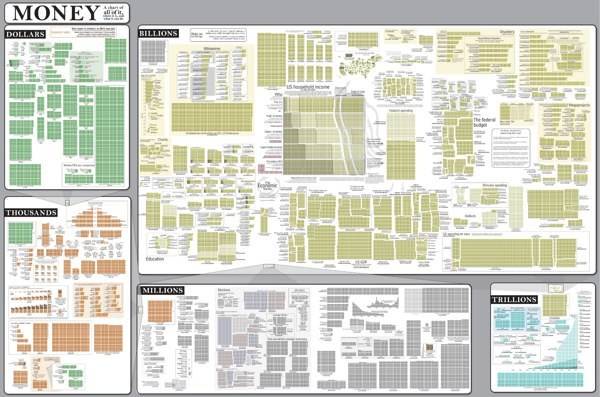
If there’s a prize for best infographic, ever, then Randall Munroe has won. Hands down. The winner? His Money infographic posted Monday. This monster infographic comes with full sources in CSV format and covers everything from Barenaked Ladies to 2012 presidential fundraising.

If you ever wanted to see money put into very detailed perspective, this will do it for you. Munroe starts with visualizations based on the dollar, like a Starbucks Coffee ($2.00) to a comparison of hourly worker and CEO pay between 1965 and 2007.
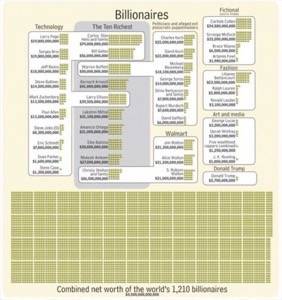
From there, Munroe goes on to compare box office revenue from Snow White to Avatar, and annual profits of AT&T, Verizon, and JP Morgan Chase. The U.S. Household Income visualization alone is worth the time downloading the 6.7MB image. See also the section on billionaires.
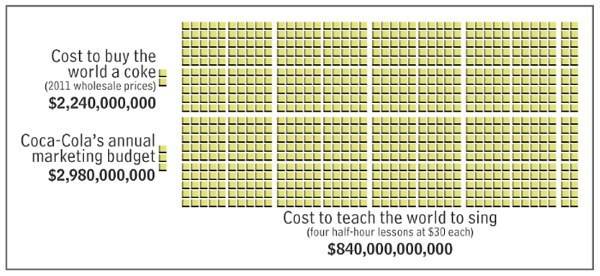
Want to know the cost to buy the world a Coke? That’d be $2,240,000,000. The folks at Coke could do it, given the marketing budget of $2,980,000,000. Teaching the world to sing? That’s trickier, given four half-hour singing lessons that run $30 a pop ($840,000,000,000). The Coke info is right next to U.S. foreign military aid ($11,010,000,000) and all the tea in China (a steal at $4,210,000,000).
The entire chart is 12,528 by 8,352 pixels. That would take five Apple 27″ Thunderbolt Displays to render full-size, side to side. It would take 30 Apple 27″ displays to show in its entirety at full size. Or you could buy your very own copy to hang on the wall and admire without having to purchase a phalanx of $1,000 monitors.
Marketers, the xkcd Money infographic is now the standard by which all of your infographics will be measured by.