The term “Web 2.0” isn’t often used these days, but it signifies the era of the Web in which social, read/write technologies came to the fore. Google was the golden child in Web 2.0, whereas Facebook is the equivalent today in the ‘Social Media’ era. Regardless of the terminology, the leading Internet companies of today are more competitive with each other than ever before. Whether it’s Google+ vs. Facebook in social networking, Microsoft vs. Google in search, Yahoo! vs. itself in just about everything else, it’s good to step back and take a higher level view of the current Web era.
That’s what the Web 2.0 Map aims to do. It’s updated annually by the organizers of the Web 2.0 Summit, one of the leading tech events on the calendar. New in this year’s map is The Data Layer, which represents the major Internet companies as “cities of data.”
You can see the entire map embedded below and if you’re interested, check out the full version on the Web 2.0 Map page. In this post I’d like to call attention to the social networking part of this world, which is the most interesting currently – given Facebook’s re-design and ongoing Google Plus developments.
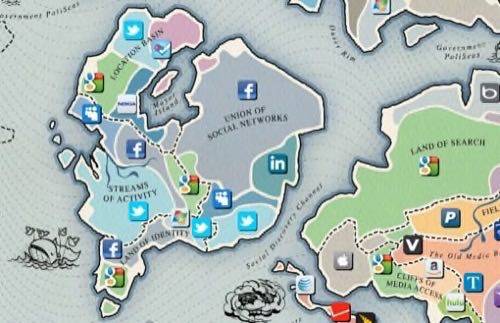
The Territory Mode of the map shows the competitive landscape, with each market segment represented as a country (or a region, sometimes it’s difficult to see the difference). Note that it only shows the “incumbent” company in each country. So for example Facebook is shown as the incumbent of the consumer social networking space. LinkedIn and MySpace also each have a country in Union of Social Networks.
Strangely, Google+ isn’t listed in Union of Social Networks. The Google logo in the screenshot, next to MySpace, refers to the Streams of Activity country. Although, Google+ has only just started to experience exponential growth, after it opened to the public last week. Which probably explains that omission. This also illustrates just how fast the Web world shifts and changes!
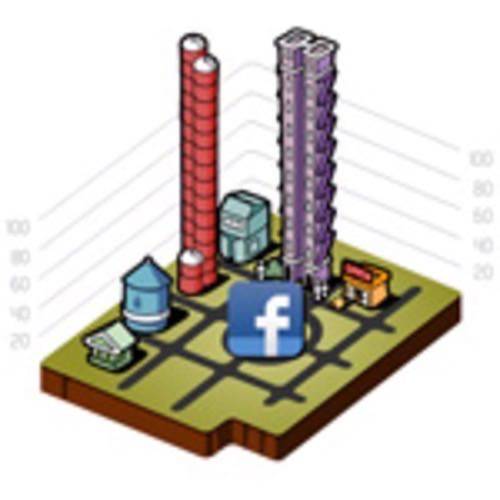
The Data Layer (a different view of the map) shows the incumbents as cities. Each city is made up of buildings that correlate to eight data segments, such as “Social Data” and “Interest Data.” The size of each building is determined by an ‘Engagement Score’ – calculated from data points provided by Nielsen, including sessions per person, pages per person and time per person. In other words: the more engaged the site is in a particular data segment, the higher the building.
In Union of Social Networks, for example, Facebook is shown as having a skyscraper of “Social Data,” along with a nearly-as-tall edifice that is enigmatically described as “Wildcard Data.” The map legend defines Wildcard Data as “data that is uncategorized, but could have huge implications.” In an explanatory post, Web 2.0 Summit co-chair John Battelle described two examples of Wildcard Data: “For example, Microsoft knows how people interact with their applications and OS. Microsoft and Google have a ton of language data (phonemes, etc.).”
Facebook’s Wildfire Data is in this example appears to refer to its Open Graph and Like buttons. So does that mean the building should now be much taller, after Facebook’s re-design last week? The Like buttons have suddenly been complimented by read, listen and watch instant sharing – as just one example of what’s changed since this map was developed.

The full Web 2.0 Map is embedded below. As noted above, the Web world constantly changes. But as of September 2011 (make that early September 2011!) this is a very good representation of the competitive landscape and some key data points. Let us know your thoughts in the comments.