The 2010 US Census has begun publishing its detailed demographic data state by state and the race now begins to see which data geeks can do the coolest things with the information. Remember when large-scale social data was only collected once a decade? When terms like “social graph” and “interest graph” didn’t even exist?

It turns out that old fashioned data still has a lot to teach us. One company has already launched its first block-by-block, state-wide data visualization site for New Jersey census data. Want to see hyper-localization and personalization in action? Check out this map from MoonShadow Mobile.
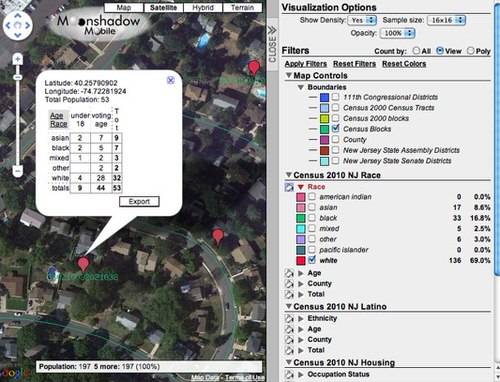
MoonShadow Mobile specializes in working with large datasets and making them easy to navigate around in quickly. The company’s service allows anyone to check out race, age, gender and other information from eight different data sets about any particular block in New Jersey. New states will be added as Census Data is released to the public. The interface is a little challenging to learn, but it may make up for that with its feature set and customizability.
MoonShadow makes its living selling similar software to public agencies and others interested in drawing redistricting lines or in municipal planning. Want to know if a location might be a good place to put a new park? A service like this can help you determine how many children live in the area.
Other data visualization projects built on the US Census include a less granular but more visually dazzling effort from well-known data desingers Stamen Design. The New York TImes has made a go at it as well; the Times does every block nation-wide, using estimated numbers.
Thanks to last week’s release of the Google Public Data Explorer, anyone can now do many things like this with big sets of public data.
Bring on the census visualizations, folks. The visualization, cross-referencing and subsequent insights enabled by this latest census are likely to far surpass what the tech world was able to do with the 2000 US Census. Just imagine what magic will be performed with the census data of forthcoming decades.
If, that is, Facebook and Twitter data don’t outshine anything the governement has been able to collect before. Data collection every ten years does seem a little old-fashioned, doesn’t it? None the less, let’s see who can top the quality of Census data. This data clearly remains very valuable.