Data visualization is a medium for understanding information that had previously been the domain of scientists and researchers.
Today, due to the amount of data available, there is an increasing need to find new ways of understanding what information means that is available through social networks and throughout the Web.
Engaging Online Communities is a report we published this week that explores ways to engage with customers. It looks at the tools available to engage, collect and analyze information.
A logical next step beyond analysis is to engage communities in ways that helps them understand information. Data visualization is increasingly seen as an effective way to do that.
According to a short report by FFunction in Montreal, data visualization has become a way to clearly communicate information that is often quite complex. People are demanding more ways to understand products and services. They want context and get some sense of meaning for what the information means.
Audrée Lapierre of FFunction writes:
“Data visualization lends itself extremely well to this kind of information by offering a new narrative form, one that is more factual, graphic, informative, social and interactive.”
But how do you engage with online communities with data visualization?
Leslie Bradshaw is the co-founder of JESS3. The agency creates data visualizations for a number of major brands.
Bradshaw presented at the Pew Voting Information Technology Summit. The presentation was about the public sector but her advice applies to any market:
Data Visualization for the Public Sector
She gave three points of advice.
The Candy Bar Wrapper Analogy
Data visualization is becoming a pop-culture phenomena.
Bradshaw:
1. “Users make credibility-based decisions based on how something looks.” -Stanford Persuasive Technology Lab
Ask yourself: is what we produce as an organization visually engaging? Do we have more words than graphics? When was the last time we refreshed our approach to graphics? If we were a consumer brand, would people “buy” into our marketing and our product based on the “wrappers” we use?
Sing a Different Song
Be interesting.
Bradshaw:
2. As data becomes more abundant, “the trick is not to make more noise, but to sound different.” -Joe Chernov, Director of Content, Eloqua
Ask yourself: Is what we produce something that blends in or stands out? Is it just “more of the same” or have we been able to produce something that is really distinctive? Think about using handwriting, cartoonists, illustrators, sketchnote takers, architects and tattoo artists to help you interpret your data.
Email and Data Visualization Don’t Mix Very Well
There’s a reason why people use cloud collaboration tools.
Bradshaw:
3. “The new frontier for organizations is not only cloud-based collaboration, but also social document sharing. Putting your content on SlideShare enables cross-platform distribution while providing a force multiplier effect from the community.” -Leslie Bradshaw, President/COO/co-founder, JESS3
Ask yourself: Are we using tools like Basecamp, Google Docs, Drop Box and Instant Message to share files and collaborate, or are we tethered to email and our internal servers? Further, are we allowing people to download, share, comment on, embed and Google our materials, or are they behind firewalls or in “Download Here” PDF format on our websites alone?
Do you create data visualizations? What advice do you have?
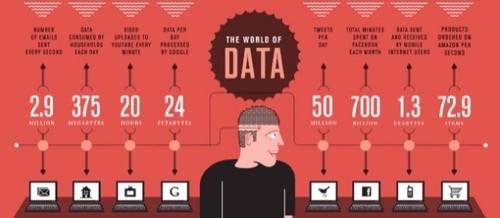
(Via FFunction: Illustration : « The World of Data », Oliver Munday for GOOD.is, October 2010)