Home Visualizing a World of Facebook Connections

Visualizing a World of Facebook Connections

How do you visualize Facebook? As Facebook engineering intern Paul Butler notes, when you have a social graph of 500 million people, there are numerous ways in which you can view the data.

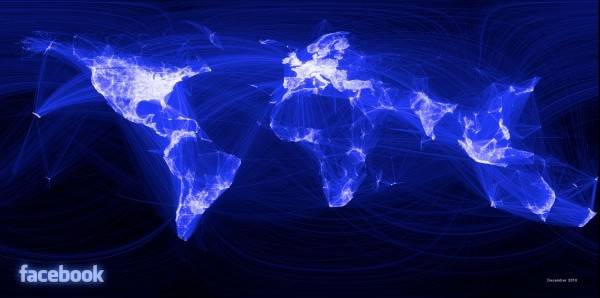
For his part, Butler has been interested in visualizing how our friendships are connected to geographic place. So he has created a visualization based on cities and the number of Facebook friendships between them.

Using the open source statistical tool R, Butler has taken data from a sample of aboutu 10 million friendship pairs, plotted them to location, and counted the number of friends between pairs of cities.

Here’s part of Butler’s explanation:

“I defined weights for each pair of cities as a function of the Euclidean distance between them and the number of friends between them. Then I plotted lines between the pairs by weight, so that pairs of cities with the most friendships between them were drawn on top of the others. I used a color ramp from black to blue to white, with each line’s color depending on its weight. I also transformed some of the lines to wrap around the image, rather than spanning more than halfway around the world.”

Butler says that when he shared the image with others at Facebook, “it resonated with many people. It’s not just a pretty picture, it’s a reaffirmation of the impact we have in connecting people, even across oceans and borders.” Indeed, it is a very powerful visualization of our world.

(You can find a high resolution image here.)

About ReadWrite’s Editorial Process

The ReadWrite Editorial policy involves closely monitoring the tech industry for major developments, new product launches, AI breakthroughs, video game releases and other newsworthy events. Editors assign relevant stories to staff writers or freelance contributors with expertise in each particular topic area. Before publication, articles go through a rigorous round of editing for accuracy, clarity, and to ensure adherence to ReadWrite's style guidelines.

Get the biggest tech headlines of the day delivered to your inbox

    By signing up, you agree to our Terms and Privacy Policy. Unsubscribe anytime.

    Tech News

    Explore the latest in tech with our Tech News. We cut through the noise for concise, relevant updates, keeping you informed about the rapidly evolving tech landscape with curated content that separates signal from noise.

    In-Depth Tech Stories

    Explore tech impact in In-Depth Stories. Narrative data journalism offers comprehensive analyses, revealing stories behind data. Understand industry trends for a deeper perspective on tech's intricate relationships with society.

    Expert Reviews

    Empower decisions with Expert Reviews, merging industry expertise and insightful analysis. Delve into tech intricacies, get the best deals, and stay ahead with our trustworthy guide to navigating the ever-changing tech market.