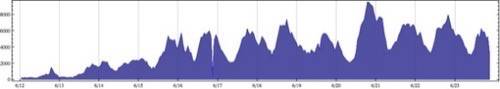
At its peak, a search for “Iran” on Twitter generated over 100,000 tweets per day and over 8,000 tweets per hour. The plot just below shows the growth in volume of information in the number of tweets per hour.
How does an Internet junkie, news organization, or political operative monitor rapidly evolving real-time events, from the crucial details to the bigger picture? More importantly, how can a data stream be turned into real-time action, reaching the people who need it, when they need it, and in a form they can easily digest?
Overview
The proliferation of real-time search engines and trend monitors (sometimes referred to as “listening platforms”) has thus far done little to address problems of this scale and importance. This is because they fail to provide context — i.e. show how a new piece of information is relevant to what we’ve seen before and where it fits in the space of possibilities and relationships.
For instance, if you are a programming director at CNN trying to discriminate between significant news and Internet memes, simply knowing that #iranelection is a trending topic doesn’t tell you its relation to other topics or which communities are driving it — both critical factors.
One promising area is data-oriented user interfaces: data and algorithmic analysis in the back-end and direct visualization and navigation in the front-end. This the next stage of social information, slicing and dicing, mixing and matching, interpreting and analyzing, completely on demand. In this new landscape, the data is the interface.
It’s not just about sitting back and looking at pretty pictures. It is about setting aside stale UI metaphors and getting as bare-to-the-bone a human interface as possible for computation. The recently launched Wolfram-Alpha applies this principle to structured data. (Disclosure: I was a member of the core Wolfram-Alpha team and may continue to consult with Wolfram Research.)
Real-time data streaming offers similar possibilities and opportunities. In this vein, let’s outline some basic ideas and methods for giving context to the streams.
The Computational History of #iranelection
At the most abstract level, history and computation are the same thing: the evolution of systems over time. Twitter has several remarkable properties that allow us to finally leverage this correspondence in tangible ways. The simplicity of its data, the openness of its system, and its extreme time resolution make it possible for us to detect atoms of history, those moments when something is triggered and society is reconfigured ever so slightly.
Look at the bandwidth plots below. They represent the relative volume of different Iran-related phrases on Twitter over time. Their most striking characteristic is how discrete and spikey they are: a tell-tale sign of an organic computational system.

The first pair of terms compares the bandwidth of “Ahmadinejad” and “Khamenei” mentions, respectively. The evolution of the uprising at the very highest level of social abstraction is shown with remarkable clarity: moving from a dispute over the election process involving Ahmadinejad (shown in pink) to a dispute over authority involving the supreme leader Khamenei (shown in red).
Not only do we get the gist of the evolution, we also see its details and relationships to other social sub-structures. For example, looking at the second plot, we see a co-relation between mentions of the Basij militia and the reports of deaths; and that initial uptick in Khamenei mentions corresponds to the uptick in Basij mentions, foreshadowing the later crackdown.
This idea of computational history applies to events that Twitter not only reported but shaped and hosted as well. A plot further down below compares the Twitter-centric discussion of #cnnfail to the distribution of Twitter proxy IPs that allowed information to continue to flow out of Iran. Is it a coincidence that these two terms merge smoothly together? And what about the big spike in mentions of proxy distribution coinciding with the first reports of violence?
Computing with Social Structures
Simply tracking the volume of various phrases gives us a sense of what is happening on the street, literally and figuratively. But that signal is but a shadow of a far more complex and intricate reality, an interwoven web of individuals and actions.
Twitter allows these social structures to become data structures by means of the “RT” convention. And this in turn allows us to perform extremely powerful computations on the social structures that underlie the flow of information.
Network layout algorithms are a familiar, powerful, and fascinating example. They self-organize in your computer to reveal self-organization in the real world. And that is exactly the kind of tool we need to test our hypothesis about #cnnfail.
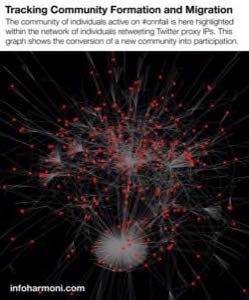
The plot below shows the network of people who re-tweeted mentions of IP proxies, with those who had tweeted earlier about #cnnfail highlighted. We see not only significant overlap among the people involved but also a considerable structure in the relationships between them. We have captured a real community at the moment of its birth.
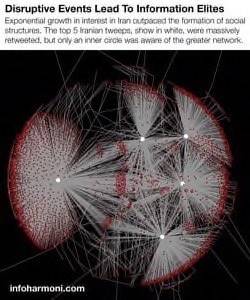
Remember this as you look at the next plot below. Here, we see the re-tweet network that formed around the top five Iranian tweets. Its structure shows a very different phenomenon, capturing the emergence not of a community but of an elite. Despite massive interest, or perhaps because of it, most people did not discover more than one of the top Iranians. The network simply grew faster than the information could naturally propagate. But a small inner circle did succeed in identifying core sources of information.
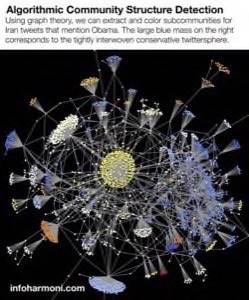
The final plot below shows yet another community structure, as well as a new algorithmic technique. This plot does not show the emergence of a new community but rather shows the appropriation of a new topic by mature political factions. This re-tweet network has formed around Iranian tweets that mention Obama. Using graph theory, we can computationally extract the sub-communities and then use that information to color the network. The large blue mass on the right is the conservative Twittersphere, while the other structures are a less-organized collection of mainstream or progressive news outlets.
Algorithms and Social Change
Will future Presidents express strategic goals in terms of Twitter graph theory? That is almost a certainty.
The purpose of these computations is two-fold: first, to contextualize information from across time and space in terms that are accessible to humans; and secondly, to distill abstract ideas into actionable form.
Twitter is a platform for achieving both of these purposes in human affairs: detecting networks of information propagation and erecting new networks to reshape emerging social computations. This is the core of Twitter’s social and business value. If we were to play that age-old game of “Guess the business model,” we’d look here first.
How to algorithmically discover and deploy novel social structures is perhaps the billion, or trillion, dollar question. With Twitter, the data and API are in place. And if the history of computation is any guide, once programming a system becomes possible, progressing from a hack to an application to a platform is only a matter of time.
Guest author: Kovas Boguta is a co-founder of Infoharmoni, a stealth startup building computable knowledge interfaces for real-time data sets. He just returned from last week’s Personal Democracy Forum, where discussion about the Iranian uprising took center-stage.