In enterprises everywhere, including even the largest ones, the transition to cloud-based architectures has brought a new class of managers into the computing process. Suddenly, personnel managers and folks whose purview had been limited to finance and personnel, are being doubled-up with oversight roles for cloud deployments. The back office is no longer in the back (or the basement), and now these new managers are wondering: What is all this we’re dealing with?

Donna Burbank – who’s a senior director of product marketing for CA Technologies’ long-time data visualization tool, ERwin, has a new phrase for this class of customers: business sponsors. “When I talk to our customers, they tell me it’s a whole new… thing, for lack of a more technical word. They’ve heard of SQL Server, but what is this SQL Azure thing? They don’t have the skill sets, and may be nervous about that. These business sponsors might not be moving the information, but they want to see it. And they don’t want to look at those database scripts. They want to look at something they can understand.”
So it is that CA Technologies found itself in the business of manufacturing a class of software that a new and growing chunk of its customers might not actually care about all that much: database visualization tools. ERwin has been the market share leader in this category ever since its creation in 1998. Its typical customers have been database architects (DBAs), the people whose jobs are to model the classifications and structures for the relational data that businesses rely upon every day.
Welcome to Your World
But the shift to cloud technologies has partly been fueled by the need for tremendous space for data warehousing – to house the huge data stores generated by millions of Internet customer transactions. It’s that shift which is pushing data outside of the constraints of traditional SQL relational databases. That push is forcing businesses to examine, some for the very first time, the structure of their data. And what they’re seeing, they don’t understand.
“A lot of the move to the cloud is a business decision. The technical people doing the move are probably still the DBAs, but they’re challenged,” CA’s Burbank tells RWW. “There will always be that core group of people who want to use a data model, that’s our sweet spot right now: the data architect, the DBA. Those people and more would like to use a Web-based interface.”
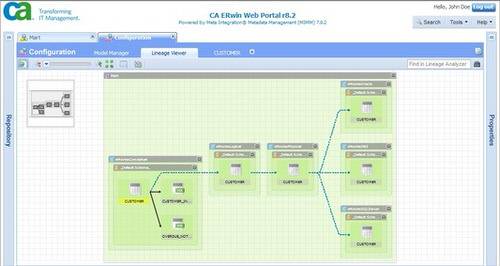
ERwin’s new Web portal, she explains, is a browser-based interface for information that has otherwise been modeled for DBAs by ERwin Data Modeler (which itself moves to version 8.2 this week). This new portal will help both architects and Burbank’s “sponsors” to analyze the relationships of data from a business impact standpoint. “If I’m building a data warehouse, I want to see how data moves from the source system to the target warehouse to the reporting tool. Maybe I’m changing a data element; what other parts of the organization are affected? You could sort of get that through ERwin’s repository [in Model Manager] with some queries, but it wasn’t the tool for that.”
The new, more objective breakdown aims to give multiple classes of users a comprehension of the data that they may have never had before. A “sponsor” who wants to search for relationships is going to expect search to behave like Google, Burbank explains. So the Web Portal tool gives that user a text-based search query line (shown above). What that user gets in return will be something that may explain what tables or fields relate to the search criteria, but it might not directly correlate to the model as the original DBA intended.
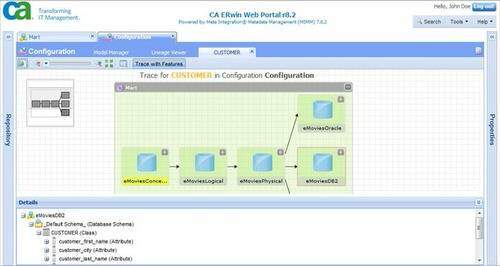
As Burbank explains, the business user, not getting a complete overview from the initial response, may decide to export the data he’s seeing into Excel, and generate some PivotTables from them. The DBA, on the other hand, may use the Portal’s new graphical impact analysis tools to drill down further, or perhaps execute a “What If?” experiment. If a column is changed on a table, for instance, the DBA can see how the rest of the schema is impacted. “It’s that type of drilldown over the Web that they could never do before,” she remarks.
Big data vs. “lots of data”
All this said, ERwin is not quite yet a data warehousing assistance tool. While CA’s Donna Burbank says it’s something her company is considering, she points out that Hadoop and the restructuring of data it entails, lend themselves to very different situations.
“I’ve done several presentations where I’ve explained to people that there’s ‘big data,’ and then there’s ‘lots of data,'” she relates. “And these are different use cases. Maybe I’m an energy company, and I’m trying to use a Hadoop-type structure to see uses across my different [operating units], and I need to eventually manage that in a warehouse. It’s that analysis of that big data that then goes into a data model. One use case [involves] massive volume, real-time, more of a programmatic approach to data. There’s a lot of messaging there around, is data modeling going away? Is data warehousing going away? Today, it’s two different use cases. You’re doing an analysis, and then you use the data model to make sense of that raw data. And if I’m going to use it for a BI report, that’s when your data model comes in. I’ve done my data analysis with the big data; here’s my data model to say which pieces of that I used in the warehouse.”
Real-time analysis of big data, she goes on, may enable DBAs to add some elements to the relational data model that they may not have seen before.
As for the other use case, Burbank agrees that data modeling may never be appealing to 100% of the “sponsor” audience. But making it appeal to a somewhat greater audience through more intuitive graphics, along with Google-like search, could go a long way toward enabling those tasked with new responsibilities to be able to better understand what they are, and carry them out with a greater sense of confidence.