With the definition of “application” in the enterprise changing very rapidly from something that is not just “as a service,” but is a service, the concept of performance monitoring changes completely. You can monitor a virtual machine, and if you’ve set up an exclusive VM to run an app, then when you monitor the VM, you monitor the app. Theoretically. Then comes the cloud, especially the case of hybrid deployments. Do you really want customers’ lack of complaints about your service’s performance to stand as your only measure of good performance?

CA Technologies, as many of my long-time readers already know, has designed management products for enterprises with a skeptical, discerning eye toward the technologies and platforms they’re monitoring. CA’s the company that brought the phrase “virtual stall” to the forefront, analyzing how VMs are deployed in an enterprise frankly and honestly, even before it had a full suite of tools to respond to the problem. Yesterday the company released an extensive upgrade to its Application Performance Manager (APM) tool, now version 9.1, includes a retooling of its dashboard in order to present easier-to-understand metrics about an application’s performance, even as it’s moved to and from the cloud.
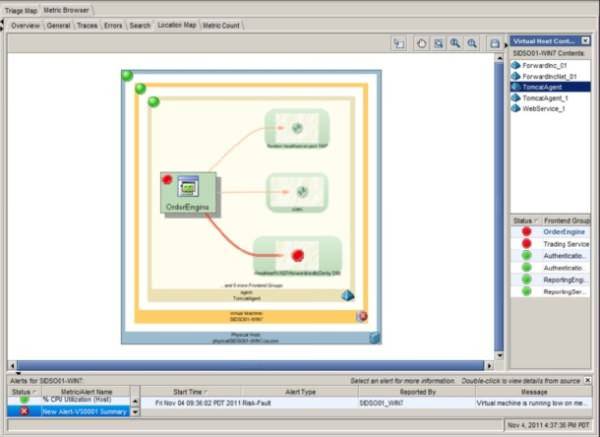
“The way we do things is, we monitor all user transactions all the time,” explains Melissa Sargeant, CA’s senior director of product marketing, in an interview with ReadWriteWeb. “And we present this performance information in something that we call an application triage map. By ‘triage,’ we mean that there could be multiple problems happening with a critical business service or an application, and there’s a lot of different moving parts within a data center or in a hybrid cloud environment. So you have to very quickly identify what is really causing the problem, and then dispatch the right resource to address it. This can be across multiple silos, be it the infrastructure layer, the network layer, or something that’s deep down in the application logic within a transaction or business service.”
APM 9.1’s new triage map now provides a view of events related to a given application on a per-transaction basis, combining those events taking place on the virtual platform with those on the physical infrastructure. The result is what Sargeant calls a “single source of truth” for application performance geared for either the support specialist or the CIO.
Sargeant offered one example of a performance situation that, in the end, is caused by the application logic. CA’s performance agents reside not in the client, but rather on the app server. It then drills down into the application itself, and can present events relative to low performance from the interpreter, which may be Java or .NET.
But let’s assume that the application resides on a public cloud where you can’t exactly install a whole bunch of agents. For those situations, the CA product manager tells us, APM 9.1 offers a tool that works on the outside of the firewall, pretending to be a user and generating synthetic transactions from multiple monitoring stations. “It can tell you how an application is performing, at times when there are no real users accessing the system,” she says. “It uses real Web browsers, and it’s actually pinging Web sites and applications to give you the response time of those applications from outside the firewall.”
The data this transaction generator returns is supplied in a format which can be compared against the business’ SLA with the cloud vendor, Sargeant continues, and which can be presented directly to that vendor when it falls below threshold levels.
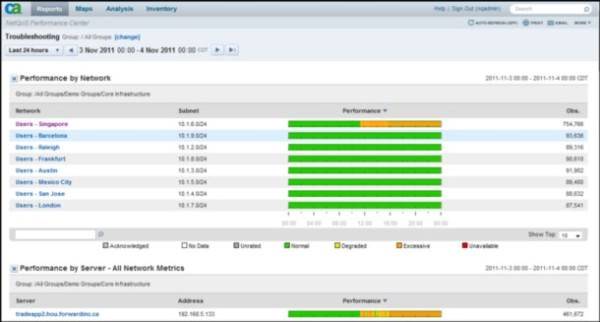
This release of APM merges the end-user experience management capabilities with CA’s existing network performance monitoring tools, within the same appliance. “This really gives that single source of truth on how the end user is experiencing those applications, but in addition, how network behavior affects end user experience.”
An IDC report produced last month on cloud systems management software shows CA Technologies taking the #2 position in global market share, with an estimated 14.7% market share – just one half-point away from market leader VMware. Microsoft currently has the #3 position.
CORRECTION: An earlier draft of this article stated that CA Technologies would give five free licenses for existing CA customers. CA’s Melissa Sargeant did mention licenses, but with respect to a different product that is not actually the subject of this article. It was the writer’s screw-up for which he sincerely apologizes.