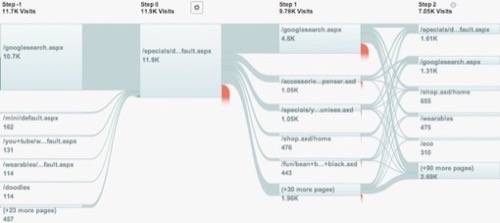
Today at the Web 2.0 Summit, Google’s SVP of advertising, Susan Wojcicki, announced a new feature for Google Analytics called Flow Visualization. It allows sorting by categories like Web browser or country, and it shows the flow of those various categories from left to right, moving around the site.

It’s like a tree of information, with the branches flowing and merging as users move from page to page, action to action. Wojcicki and Phil Mui from the Analytics team also demonstrated real-time analytics, announced last month, along with a premium version of the product. Google also announced nine more languages for Analytics today.
What does Web 2.0 mean to you? Comment for a chance to win a $500 home office upgrade. Brought to you by HP Input/Output.
“Half the money I spend on advertising is wasted. The trouble is, I don’t know which half.”
– John Wanamaker
Google took inspiration from Charles Joseph Minard‘s 1869 graph of Napoleon’s campaign in Russia:
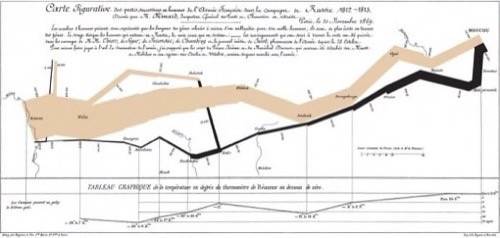
“It shows time, it shows motion, and it tells a story,” Wojcicki said. “But I can’t drill down. It’s static. I can’t make it dynamic.” To make this kind of visualization useful for Google Analytics, it has to have adjustable filters. “What happened to the people who had horses? What happened to the people who spoke Russian?” Flow Visualization lets site owners drill down to Australian visitors or IE 7 users that way.
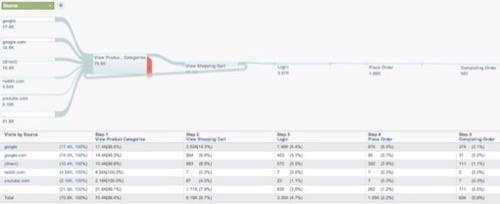
Google took inspiration from the 19th century chart and made it dynamic. The new Flow Visualization shows the march of users across a site, but it can be sorted to look at specific kinds of users. Web administrators can compare users on different browsers or systems, or from different referrers or countries, to see how their experiences differ on the site.
These new features provide a new way to use the goals administrators can set with Google Analytics. The Flow Visualization will show which users reached site goals and which ones didn’t. Read more about these new ways of reporting analytics on the Google Analytics blog.
Check out the Web 2.0 schedule and watch day 3 live here.