The first time I stood in a Major League Baseball clubhouse was a month after the original iPad came out. My editor at the time was standing next to me and joked how Apple products were like a fever in the MLB. Whenever the newest and coolest was released from Cupertino, all the players rushed to buy.

I nodded and shrugged. These are rich men that want their toys. I looked over and saw a starting pitcher sitting on a leather couch, playing Plants vs. Zombies on his iPad (he was not pitching that night). Yet, iPads and other devices permeating baseball are not all about watching YouTube or killing zombies. Combined with an era of abundant data, iPads have revolutionized the game.
This post is brought to you by Columbia Pictures “Moneyball“
Sabermetrics: Stats Can Tell You Everything
“Then you could change it to where you say, ‘I want to see all pitches low and away.’ And it will change every piece of data [to] every pitch low and away. You can draw a custom area you want to pick on that strike zone, or out of the strike zone, and see all the pitches in those locations. Then, once you draw that, it shows you the data, all his stats and numbers, for that area you’ve selected, on that type of pitch.” – Colorado Rockies video coordinator Brian Jones.
About 15 years ago, baseball started undergoing a shift. Smart general managers saw data as a way to exploit market inefficiencies that others were not yet aware of. Twenty years ago, the standard baseball statistics were hits, runs, home runs, runs batted in, hitting average, earned run average and errors. These days, those stats do not tell the whole story. Without context, they are shell numbers. It is great to know that a player hit 25 home runs, but how many runs did he create? If he hit 25 home runs yet got on base less than 25% of the time, he is actually a below average player.
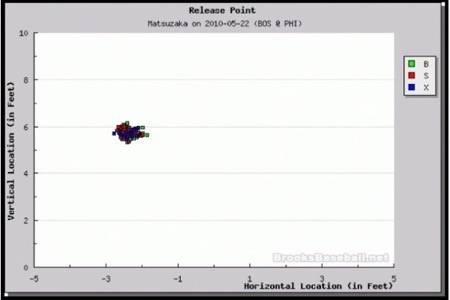
These days statistics can tell you everything you need to know about a hitter or a pitcher. Hit charts that show the spray of where a hitter normally puts the ball into play can give managers an edge by allowing them to align their defense to those statistical “hot spots.” Below is a chart of a game that Red Sox starting pitcher Daisuke Matsuzaka pitched several years ago against the Philadelphia Phillies. The chart represents the “release point,” or where the pitcher let go of the ball in his windup, for each pitch he threw in that game. For example, a hitter can study this and know that when the pitcher throws a fastball, he tends to release it at a specific point in his delivery over time. (Chart from Brooks Baseball)
This new era of advanced baseball statistics is called Sabermetrics. The term is derived from the name of the research organization Society for American Baseball Research, a.k.a SABR. SABR is also a mathematical “stochastic volatility model” used in financial derivative markets. Along with SABR there are a variety of baseball professionals and stat enthusiasts who spend their lives analyzing baseball statistics. FanGraphs, Baseball Reference are two of the most popular destinations for statistical research and a great resource for sports writers, managers and players. There is even a Chrome extension that allows people to search all of these websites directly from the address bar. Almost all major league teams now have divisions in their front offices dedicated solely to advanced statistical analysis. Data has changed the game.
The iPad Revolution
Former NASA CTO Chris Kemp once told me that “tablets are the gateway to the cloud.” It is a line that has stuck with me.
Think of data as a silo that exists within the cloud. That data can be tapped at anytime, from anywhere, using tablets with applications specifically designed to access the data and give it context.
That has precisely what is happening in baseball.
Before the iPad, some of the geekier players in baseball would load data and video on to iPod Touches and research past performance when they were working out or on a plane to the next city. Say that a Red Sox second baseman wants to see every plate appearance he has ever had against Yankees starting pitcher C.C. Sabathia. The Red Sox stats and video department could queue up those instances and download them onto Pedroia’s iPod, to be used at his leisure.
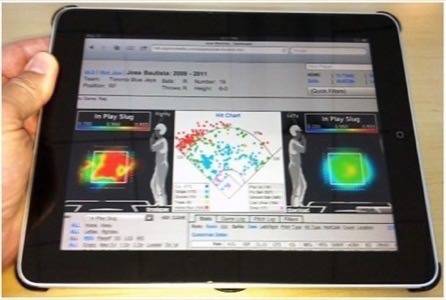
Image: ESPN
The iPad has taken this a step further. Video can now be accompanied with charts and data, all on the same screen. The player does not need to have the video department download any thing, it is available on tap from the cloud.
ESPN senior baseball writer Jayson Stark illuminates how the iPad and statistical analysis has changed baseball. He posted an article on ESPN in late August that is a one of the most comprehensive looks at how the Information Age, especially iPads, is changing the fundamental nature of baseball.
“You have all these boxes you can change,” Brian Jones, the video coordinator for the Colorado Rockies, said to Stark. “Say you want to look at all right-handed pitchers versus Carlos Lee. It will pull up a strike zone and a guy standing there, and it will show you, like, every pitch. Then you can break it down by date. You can change the date range, and it will give you his stats, the pitches thrown, swing-and-miss percentage, everything you can think of, for those dates.”
Baseball Just The Tip Of The Spear
Other sports have jumped into advanced statistical analysis as well. Basketball probably has the second highest rate of advanced statistical usage while football and hockey provide more challenges for the penetration of advanced statistics. That is not to say that hockey and football do not use advanced stats, it is just that the sports have not developed a research community that focuses on them the way that baseball has.
Now, think away from sports. Organizations and enterprises such as large companies and federal agencies are starting to see the value of data on tap available through tablet interfaces. Baseball is a fun example but how people, businesses and organizations access data is fundamentally changing how people go about their daily lives.