Sencha Touch Charts are a new offering from mobile app framework and tools provider Sencha. Recently launched into beta, these charts lets mobile developers build HTML5 Web applications for data visualization and exploration.
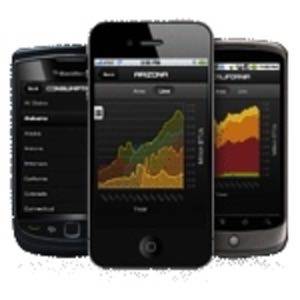
Mobile users can then manipulate the charts using familiar gestures – swipes, pinches, reverse pinches, drag-and-drop, etc. – to really interact with data, on either their phone or tablet computer.
Built with HTML5
Sencha Touch Charts use HTML5 Canvas technology, which is supported by modern WebKit browsers that ship with Android, Apple iOS, BlackBerry OS6 and HP WebOS. The platform was built on top of the core drawing and charting system from Ext JS 4, also from Sencha.
By using Canvas, the company says it was able to leverage capabilities like drop shadows which are hardware accelerated on many browsers.
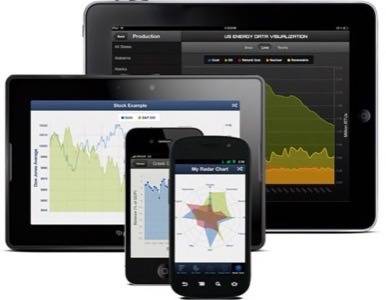
The charts are ideal for use in business, financial and scientific Web applications involving complex data visualizations. Users can swipe to pan across data sets, pinch to zoom into details, and even perform more complicated manipulations like axis swaps, aggregation and filtering, all using gestures. The gestures are completely configurable, too – developers can make pie charts spin by a drag or a pinch, for example, or enable bar graphs to be manipulated with zoom, drag-and-drops, pans, and more.
In addition, Touch Charts support both the smaller screens found on smartphones as well as the larger screens on tablets. Portrait and landscape modes are also available.
For developers getting started, there are several example charts and sample apps available here on Sencha’s dev site. To try the Charts for yourself, the download (including the full source for examples and documentation) is available here.