Home Spinning in Circos

Spinning in Circos

When you have data you wish to visualize there are many options. A recent graphic that made the news involved a depiction of the lawsuits in the tech world. The graphic was in response to prior depictions in an attempt to simplify and convey the meaningful trends of the data represented.
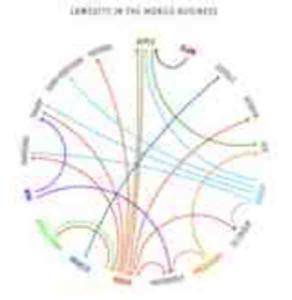
Let’s take a closer look at the software package behind that graphic and how you might use it in your next project.

Setting the Table

Circos is a Perl based software package that allows anyone to quickly visualize data. Where Circos departs from your typical scatter plot or canned style graph in a spreadsheeet is the unique circular layout. It is this circular layout that might appeal to you for considerations of relationships or proximity from a table you have compiled.

You can download, install, and run Circos tools but there is also an online version of Circos if you have a small data table to consider. For larger tables you’ll want to do your own installation on a dedicated server or desktop.

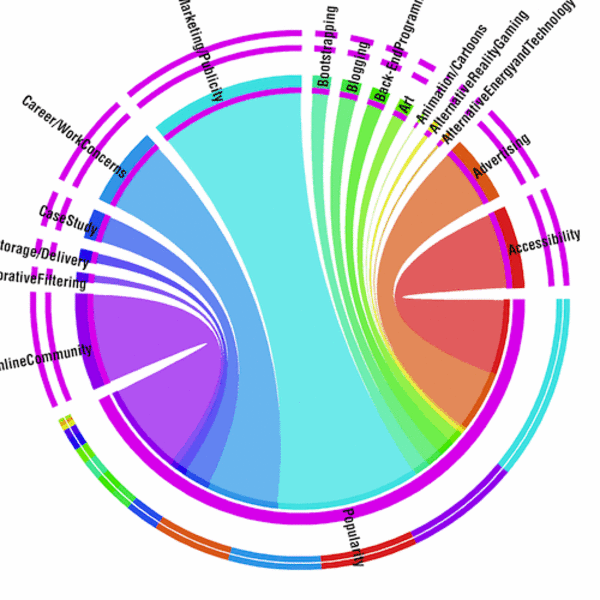
Here’s an example showing the relationships between Interactive panel submissions for SxSW 2011 from panelpicker.sxsw.com. As you can see in terms of Popularity, “Branding/Marketing/Publicity” is a popular topic for submission.
What do you plan to visualize with Circos? Let us know in the comments below!

About ReadWrite’s Editorial Process

The ReadWrite Editorial policy involves closely monitoring the tech industry for major developments, new product launches, AI breakthroughs, video game releases and other newsworthy events. Editors assign relevant stories to staff writers or freelance contributors with expertise in each particular topic area. Before publication, articles go through a rigorous round of editing for accuracy, clarity, and to ensure adherence to ReadWrite's style guidelines.

Get the biggest tech headlines of the day delivered to your inbox

    By signing up, you agree to our Terms and Privacy Policy. Unsubscribe anytime.

    Tech News

    Explore the latest in tech with our Tech News. We cut through the noise for concise, relevant updates, keeping you informed about the rapidly evolving tech landscape with curated content that separates signal from noise.

    In-Depth Tech Stories

    Explore tech impact in In-Depth Stories. Narrative data journalism offers comprehensive analyses, revealing stories behind data. Understand industry trends for a deeper perspective on tech's intricate relationships with society.

    Expert Reviews

    Empower decisions with Expert Reviews, merging industry expertise and insightful analysis. Delve into tech intricacies, get the best deals, and stay ahead with our trustworthy guide to navigating the ever-changing tech market.