In our last post on data journalism, we ran across a number of tools that would be helpful for anyone who is interested in how to make sense of data.

The tools represent a renaissance in how we make sense of our information culture. They provide context and meaning to the often baffling world of big data.
This is a snapshot of what is available. We are relying on the work done by Paul Bradshaw, whose blog is an excellent source about the new world of data journalism.
Factual
Factual provides simple APIs for building Web and mobile apps. For instance, it provides data on local geographies. According to Factual, the datasets include businesses and points of interest (parks, airports, theaters, tourist attractions, etc.), and attributes include: name, address, phone, category and latitude/longitude.”
How To Create a Table With Factual
on Howcast
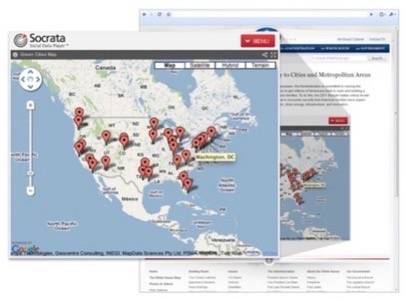
Socrata
Socrata is one of a handful of companies and organizations that are shaping the open data movement in government. The company provides ways for federal, state and local governments to make data available online in a simple-to-use way.
Google Fusion Tables
Google Fusion Tables is a Google Labs project. It is a data management tool to host, manage, collaborate on, visualize, and publish data tables.
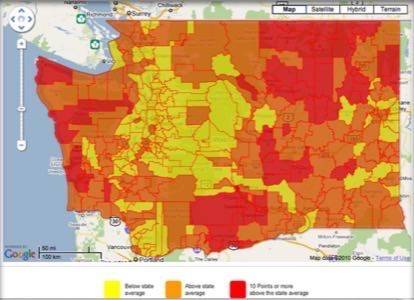
WikiEDData uses Google Fusion Table to map poverty levels in Washington state school districts:
“Yellow indicates the latest district poverty levels are below state average, orange means the levels are above state average, and red means that the poverty levels are 10 percentage points or more above state average. Clicking on a district will bring a link to the district along with the poverty data over time. “
Yahoo! Pipes
Yahoo! Pipes is a tool that can make anyone a data plumber. You can aggregate feeds and mashup information from around the Web. This Pipe shows U.S. population by state.
OpenHeatMap
OpenHeatMap is another example of how to turn data into maps.
These are five tools that can be used for online journalism or any online research project. They show how ingrained data has become in our lives and why tools like these are so valuable in defining who we are and the stories we want to tell.