There are things that don’t translate from the analog to the digital world, and vice-versa. Mercifully, maps are one of those things that most decidedly do. The estimable Map Room blog points out why National Geographic remains a source for data junkies. They’ve mapped the economy of the spill in the Gulf of Mexico.

Geography is not so much the study of where things are as why where they are is important. This interactive map sets out the data the defines where geology and ecology meet the flow of money. It includes over 4,000 offshore oil platforms and the thousands of miles of pipelines.
The map is, as NatGeo maps are, excrutiatingly detailed, but outfitted with extremely smooth zooming.
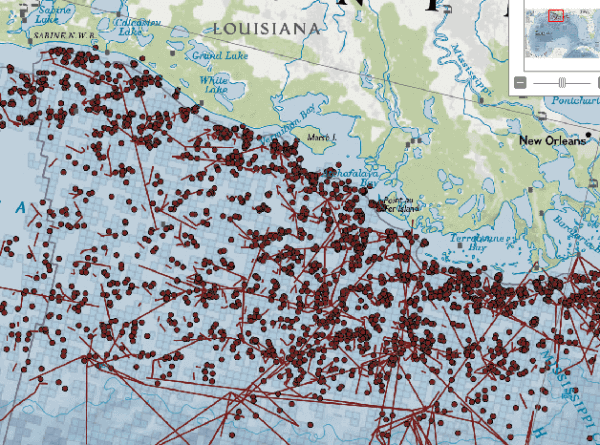
The data is envisioned as a treed relationship. Given the context of this spill, it is hard not to think of the image that results as either the spread of a pernicious mold or the spotting and running of rills and puddles of oil.
If you’re not already aware of the extent of the oil industry in the Gulf, you’ll probably be shocked. It helps also, perhaps, to understand why the people in the region value the industry so much; it employs many people, and they in turn keep dependent businesses afloat.
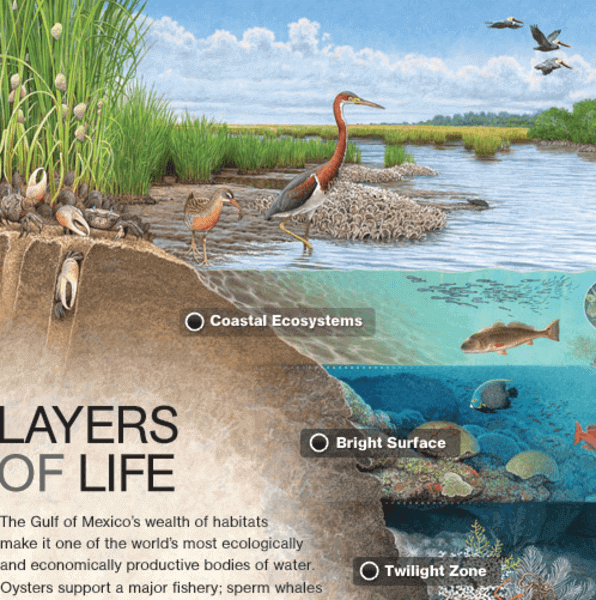
Also online National Geographic provides a graphical presentation of the back-of-map information that comes with the paper version. It outlines the layers of life present in, above and below the Gulf. Those elements are clickable for a more detailed outline of the layer’s function in the ecology of the region.
I hear what you’re saying. “I read National Geographic for the articles.” Sure you do. Me too. *wink* Well, for the sake of appearances, here’s a link to the accompanying article. (Some, admittedly, may claim it’s the maps that accompany the article. As if.)
Coverage of the oil spill was well served by socialmedia. Now that outflow has ended, this is a good place to begin seeking context for what happened. The oil spill after all has not really ended.
If you’ve got other tools for understanding the long-term effects of the spill, we’d love to hear about them in the comments.