Pete Warden is many things to many people. To Facebook corporate headquarters, he’s a pest to manage with legal pressure. To nerdy bloggers around the Web, he’s a thoughtful guy who stops by and drops smart comments here and there. At ReadWriteWeb, we think of him as one of our favorite data geeks online.

Now Pete Warden is aiming to become something new: the guy who built the easiest way to publish maps on any website. His new project OpenHeatMap is an open-source tool to embed visualizations of data with a location element and changes over time. It works in Flash or HTML5, and it could be just the hackable thing you’re looking for – if you’re looking for a way to see where time, space and a set of numbers all come together.
Warden’s been working on the service for six months, and he describes it like this: “My one-sentence description is ‘YouTube for maps,'” he says. “If you have location data in an Excel spreadsheet, you can save it out as a CSV file, upload it to OpenHeatMap and get an interactive online map that you can customize, share and embed.” It’s a GPL JQuery plug-in that lets you display data with a location component, as well as over time.
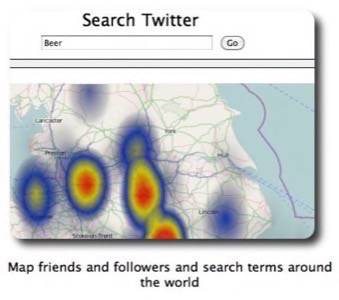
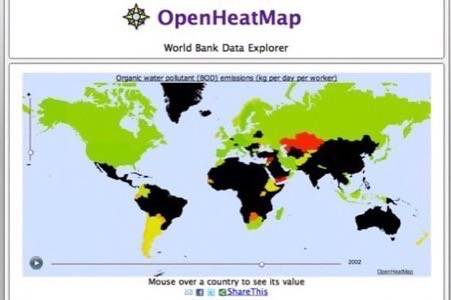
Curious about where people around the world are Tweeting about a particular topic the most? Want to see world income levels as reported over the last 100 years by the World Bank, playing forward like a little movie map? Got your own data set you want to put on a map? That’s what OpenHeatMap aims to make easy to do.
Why This Is Important
“This has the potential to make public data relevant to the lay user,” Alex Howard, government 2.0 beat writer for O’Reilly Media, says.
“One of the biggest challenges government agencies, municipalities and any other body has is converting open data to information which people can take knowledge from. One of the most powerful ways humanity has developed to communicate information over time is through maps. If you can take data in an open form – and CSV files are one of the most standard formats available – then you have an opportunity to tell stories in a way that’s relevant to a region and personalized to an individual. That’s a meaningful opportunity. The fact that you can embed it and that it’s licensed on GPL and on GitHub is a significant contribution by Pete Warden to humanity’s ability to tell stories.”
The service isn’t perfect at launch – it’s still buggy and rendering is a little slow – but OpenHeatMap could be the beginning of something very useful and important.