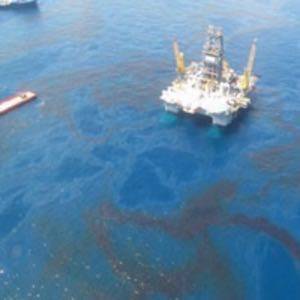
In the wake of the BP oil disaster, real-time mapping technologies have been recruited to improve communication and promote collaboration between people in local communities, as well as federal, state and local responders. Last week NOAA released GeoPlatform.gov to provide near-real-time mapping data to those connected to the crisis.
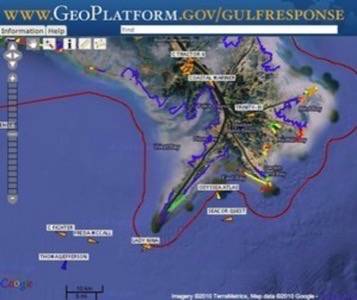
The site lets you track everything from daily spill positions to the locations of ships responding to the crisis. State and non-governmental organizations are also collecting and mapping real-time information. In some instances the efforts include citizen-generated data from iPhone apps and photos mapped on sites like Flickr.
GeoPlatform.gov, which is designed to be a one-stop access point for location data, uses a Web-based mapping system called ERMA (Environmental Response Management Application). Its list of data layers includes spill trajectories, shoreline conditions, and the current positions of ships registered as responders. NOAA hopes to add things like wildlife impacts, field photos, and agency analysis to the site in the near future.
LA Earth (Louisiana Earth) is a Google Earth Enterprise Server operated by the state of Louisiana that provides daily oil spill trajectories, closures, and many other maps as a Google Earth layer (kml). (Download the Google Earth Client/Plugin to use the date.)
Crisis and Crowd-sourced Mapping
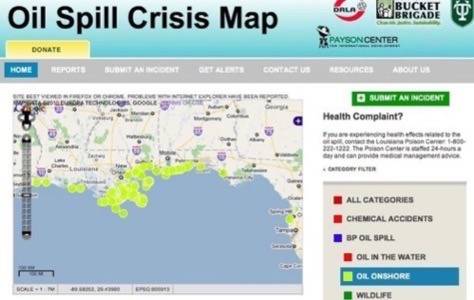
There are several ways that that Gulf locals are mapping and reporting spill related incidents. The Oil Spill Crisis map was created buy the Louisiana Bucket Brigade and students at Tulane University. The map shows hundreds of reports sent through SMS messages, Twitter and the Internet. The map was built using open-source crisis mapping software developed by Ushahidi.
The sensors built into smartphones are collecting a rich stream of spill-related data for mapping. The iPhone app Oil Spill Response (iTunes download) allows you to file mobile reports on wildlife, oiled shorelines and other types of spill-related damage. Oil Reporter was created by Crisis Commons and is available for both iPhones and Android smart-phones. It geotags photos, files reports, and provides information on how to contact authorities or volunteer.
See also:
- BP Exec to Brave YouTube Questions Live Tomorrow
- Web Makes the Difference for New Orleans Musicians
- Mapping the Oil Spill in Real Time
- White House Will Answer Your Oil Spill Questions from YouTube Tonight
- Cartoon: Just Venting
- Oilaholic: Oil Spill Goes Real-Time
- 5 Intersections of the Real-Time Web and the Deepwater Horizon
Beyond the information collected by the government and oil industry, people are documenting their own stories. Communities are forming on photo sharing sites like Flickr where location-tagged images can be visualized using Flickr Map.