Yesterday I filled the gas tank of my Toyota Camry and it came to just under $60. To be fair, it could have been a lot worse — compared to many parts of the country, where I live gasoline is still relatively cheap. But in this world of rising fuel costs, tracking your gas consumption is a necessity if you want get any relief from the pain at the pump. FuelFrog, a new web app that launched last week from Durham, NC-based Second Pixel, aims to make tracking your gas mileage and consumption easier and more edifying.

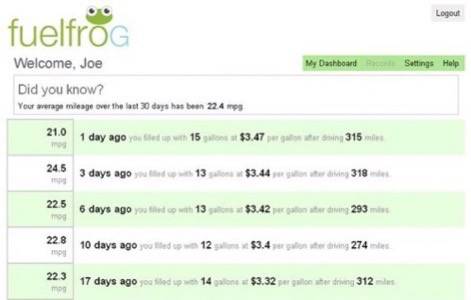
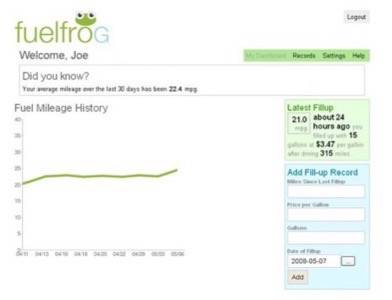
FuelFrog is exceedingly simple, and immensely useful. After each fill up, users enter their miles traveled since the last fill, the price paid, and the amount of gasoline in gallons. Over time, FuelFrog will track and graph your fuel consumption data so you can do things like identify trends in gas prices in your area, see how fuel efficient your car is (is it time to put air in the tires, perhaps?), how much you’re driving, and how much you’re spending.
Information can be entered via the web, or via Twitter, which powers the site’s mobile compontent. Twitter integration means that you can log your fuel data immediately after filling up. (It could also suggest a future monetization model for Twitter, in which the site sells API access to companies looking for an easy way to support mobile access to their web applications.)
Eventually, FuelFrog plans to give users access to aggregate data from other users, so you can compare your vehicle’s fuel consumption against another make and model, for example, or your city’s average gas prices to those in another area.
“We’re paying more attention to our impact on the environment today than we ever have before and FuelFrog is making it easier to track fuel consumption and the impact, not only on our wallets, but on the environment,” said Second Pixel co-founder David Rasch in a press release.
FuelFrog joins a growing list of apps that are attempting to leverage the distributed nature of Twitter to gather useful data. Commuter Feed (our coverage), which uses Twitter to map traffic congestion, is another.